

FRAX is a calculator that estimates your 10-year probability of hip and major osteoporotic fractures, combining clinical risk factors with population data. Clinicians commonly recommend treatment discussion when the score reaches certain guideline thresholds for hip fracture or major osteoporotic fracture in postmenopausal women and men 50 and older. You can get a valid FRAX score with or without a bone density scan.
TL;DR:
- FRAX estimates 10-year hip fracture risk and major osteoporotic fracture risk, with thresholds for treatment being 3% for hip and 20% for major fractures.
- FRAX may underestimate risk in individuals with multiple fractures, silent spinal fractures, or high-dose steroid use, requiring clinician adjustments.
- The tool is most useful for patients with osteopenia (T-score between −1.0 and −2.5), helping decide if they cross treatment thresholds.
- A FRAX score should be combined with a full clinical assessment, including DXA results and medical history, to guide personalized fracture prevention strategies.
Table of Contents
- What is a FRAX score, and why was it created?
- What information does the FRAX calculator actually use?
- How do clinicians use FRAX to decide on treatment?
- Where FRAX falls short: risk it tends to underestimate
- Reading your DXA T-score alongside your FRAX result
- How to get your FRAX score and prepare for the conversation
- Using FRAX as a starting point, not a verdict
- Practical advice for interpreting your own results
- An adjunct approach worth discussing with your clinician
- Sources
What is a FRAX score, and why was it created?
FRAX stands for Fracture Risk Assessment Tool, and it does one job: it predicts your 10-year odds of two fracture categories. The first is hip fracture alone. The second is “major osteoporotic fracture,” a combined category covering the hip, spine, forearm, and shoulder. You get two separate percentages, not one overall number.
Before FRAX existed, doctors leaned almost entirely on bone mineral density (BMD) scores from a DXA scan to decide who needed treatment. That approach had a real blind spot. Plenty of fractures happen in people whose bone density technically falls in the “osteopenia” range, not full osteoporosis. Bone density alone was missing a large share of the people who actually went on to break a bone.
Researchers at the University of Sheffield built FRAX to close that gap. Instead of relying on one number, it factors in age, sex, weight, fracture history, family history, and several lifestyle and medical variables, then runs them against country-specific fracture and mortality data. The result is a probability that reflects your actual risk profile, not just what your skeleton looked like in a scan.
The tool has been tested against real-world outcomes in large validation cohorts, and it performs well for its primary purpose. For hip fracture prediction specifically, validation studies report discrimination in the AUC range of roughly 0.82 to 0.85, a solid result for a tool built on a short list of easily collected variables rather than expensive imaging.
What makes FRAX genuinely useful in a clinical setting comes down to a few design choices:
- It produces two distinct outputs (hip fracture risk and major osteoporotic fracture risk) instead of one blended score, so clinicians can weigh them separately.
- It adjusts for the country you live in, because fracture rates and life expectancy vary enough between populations to change the math meaningfully.
- It works whether or not you have a recent bone density scan, which matters for people who haven’t been referred for DXA testing yet.
- It was built for treatment decisions specifically, not just risk awareness. The output maps onto guideline thresholds that tell a clinician when a conversation about medication makes sense.
That last point separates FRAX from a generic risk quiz. It was never meant to just tell you “your bones are getting weaker.” It was built to answer a sharper question: does your 10-year risk cross the line where the benefits of osteoporosis treatment likely outweigh the costs and side effects? Everything downstream, the thresholds, the treatment guidelines, the way your doctor reads the result, exists to answer that one question.
It’s worth understanding what FRAX doesn’t do. It doesn’t diagnose osteoporosis. It doesn’t replace a DXA scan. It doesn’t account for every risk factor that affects your bones (more on that shortly). It answers a narrower, more practical question: given what we know about you, what’s the statistical likelihood you break a hip or a major bone in the next decade? That narrower focus is exactly why it works as well as it does.
What information does the FRAX calculator actually use?
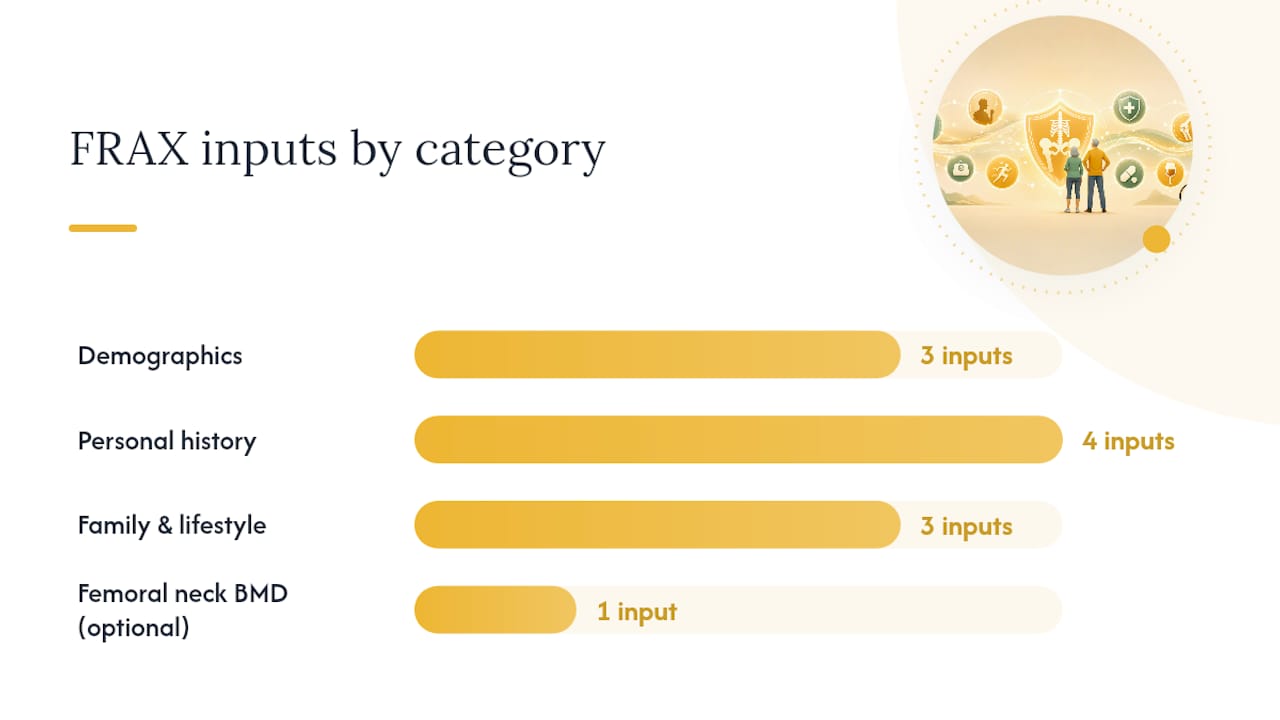
FRAX runs on eleven inputs, and understanding what each one does helps you make sense of your own result instead of just staring at a percentage.
Age and sex come first, because fracture risk rises steeply with age and differs by sex at every age band. Height and weight get converted into body mass index, since lower body weight correlates with lower bone density and higher fracture risk, independent of everything else in the model.
From there, the tool asks about your history and your family’s history:
- Prior fragility fracture: a bone broken from a fall from standing height or less, after age 50, which is one of the strongest single predictors of future fracture.
- Parental hip fracture: a mother or father who fractured a hip signals shared genetic and bone-density risk.
- Current smoking: active smokers carry higher fracture risk, tied to lower bone density and slower healing.
- Long-term glucocorticoid use: oral steroids taken for conditions like asthma, lupus, or inflammatory bowel disease weaken bone over time.
- Rheumatoid arthritis: the inflammatory disease itself, independent of any medication used to treat it, raises fracture risk.
- Secondary osteoporosis: conditions like type 1 diabetes, untreated hyperthyroidism, or early menopause that cause bone loss as a side effect.
- Alcohol intake of three or more units daily: heavy regular drinking is associated with reduced bone formation.
- Femoral neck BMD (optional): the T-score from a hip DXA scan, which sharpens the estimate when available.
Here’s where FRAX has a built in limitation worth knowing about before you look at your own number: most of those risk factors are dichotomous, meaning the calculator only accepts a yes or no. It asks whether you smoke, not how many packs a day. It asks whether you take glucocorticoids, not whether you’re on a low maintenance dose or a high one for years. It asks about alcohol at a single cutoff, not a sliding scale.
Pro Tip: If you’re a heavy smoker, a long-term high-dose steroid user, or someone who drinks well above the three-unit threshold, treat your FRAX percentage as a floor, not a ceiling. Mention the specifics to your clinician so they can mentally adjust upward, because the calculator itself can’t.
That dichotomous structure explains a common source of confusion. Two people can enter identical “yes” answers for glucocorticoid use, one on a low inhaled dose for mild asthma and one on a high daily oral dose for lupus, and get the exact same risk bump from that input, even though their actual bone-loss exposure is nowhere close to equal. Clinicians are aware of this gap and often adjust their interpretation manually rather than treating the raw output as gospel.
Adding femoral neck BMD tends to refine, rather than radically change, the estimate. A 2026 patient with strong clinical risk factors but a mildly low BMD might see their score shift a few percentage points once the scan result gets entered, sharpening precision without flipping the overall picture. If you don’t have a recent DXA, the tool still runs on the other ten inputs. It just does so with somewhat less precision.
How do clinicians use FRAX to decide on treatment?
The Bone Health and Osteoporosis Foundation sets the two thresholds that most U.S. clinicians reference: consider pharmacologic treatment when the 10-year probability reaches 20% or higher for major osteoporotic fracture, or 3% or higher for hip fracture specifically. These apply to postmenopausal women and men age 50 and older, the population FRAX was validated against.
Crossing either threshold alone is generally enough to open a treatment conversation, even if the other number stays lower. A patient might land at 22% for major osteoporotic fracture while sitting under 3% for hip fracture specifically, and that first number still triggers the same clinical discussion.
FRAX isn’t the only route to a treatment recommendation, though. A T-score of −2.5 or lower on DXA, the technical definition of osteoporosis, is its own independent indication for treatment regardless of what FRAX says. If your bone density scan already puts you in osteoporosis territory, your doctor doesn’t need FRAX to justify starting a conversation about medication. FRAX earns its keep mainly with the group in between: people with osteopenia (T-scores between −1.0 and −2.5) who don’t automatically qualify for treatment on BMD alone, but whose combined risk factors might still put them over the guideline line.
A typical clinical workflow looks something like this:
- A postmenopausal woman or man 50+ gets a routine DXA scan, often prompted by age, family history, or a previous minor fracture.
- If the T-score lands in the osteopenia range, the clinician runs FRAX using the DXA’s femoral neck BMD value alongside the patient’s history.
- If the result clears either guideline threshold, treatment options get discussed. If it stays below both, the conversation usually shifts toward monitoring and prevention.
- If the T-score already shows osteoporosis, treatment gets discussed directly, and FRAX becomes more useful for tracking risk over time than for the initial decision.
Some clinicians also use age-adjusted or hybrid approaches, weighing FRAX more heavily in younger postmenopausal patients where BMD alone under-predicts risk, and leaning more on the T-score in patients over 75 where fracture risk is already elevated across the board. There’s no single universal formula here. FRAX gives a number; how much weight that number carries depends on the full clinical picture.
Where FRAX falls short: risk it tends to underestimate
FRAX is a strong screening tool, not an oracle. Its own developers and independent reviewers have flagged specific situations where the calculator’s output runs lower than a patient’s actual risk.
Multiple prior fractures is the clearest example. FRAX asks a single yes or no question about fracture history. Someone with one wrist fracture at 55 and someone with three vertebral fractures and a hip fracture by 60 both answer “yes” to the same field, yet their real-world risk of a future break is nowhere close to equal. Reviewers of the tool point out that fracture count and recency both matter, and neither gets captured.
Silent spinal fractures compound this problem. A meaningful share of vertebral compression fractures never get diagnosed, because they don’t always cause the kind of pain that sends someone to get imaged. A patient might have an undetected spinal fracture sitting on an old X-ray that nobody flagged, meaning their FRAX input for “prior fracture” reads as “no” when the honest answer is “yes.”
A few other blind spots are worth knowing:
- Falls history isn’t an input at all, despite being one of the strongest predictors of hip fracture specifically, particularly in older adults with balance or mobility issues.
- High-dose or long-duration medication exposure gets the same weight as low-dose or short-term use, understating risk for patients on aggressive steroid regimens or certain other bone-depleting drugs.
- Patients already on osteoporosis treatment present a different problem entirely: FRAX was built for treatment-naïve people, so a standard FRAX run on someone already taking medication may not reflect their current, treatment-modified risk.
- Population calibration varies, and some groups, including certain younger patients and those outside the age ranges the original cohorts studied most heavily, are less precisely represented in the model.
None of this makes FRAX unreliable for its intended purpose. It means the raw percentage is a starting point for a clinical conversation, not a final verdict, especially if your history includes any of the situations above.
Reading your DXA T-score alongside your FRAX result
Your DXA report gives you a T-score, a comparison between your bone density and that of a healthy young adult. The categories are straightforward: a T-score of −1.0 or higher is normal bone density, between −1.0 and −2.5 is osteopenia (lower than normal but not yet osteoporosis), and −2.5 or lower is osteoporosis by definition.
The two numbers, T-score and FRAX percentage, answer different questions, and reading them together is where the real clinical decision happens.
| T-score range | What it means | Typical next step |
|---|---|---|
| −1.0 or higher (normal) | Bone density in the expected range | Monitor; FRAX rarely changes management here |
| −1.0 to −2.5 (osteopenia) | Below normal, not yet osteoporosis | Run FRAX; treat if thresholds are met |
| −2.5 or lower (osteoporosis) | Meets clinical definition | Treatment typically indicated regardless of FRAX |
The osteopenia band is where FRAX does its heaviest lifting. Two people can share an identical T-score of −1.8 and get very different treatment recommendations once their fracture history, family history, and lifestyle factors get run through the calculator. One might sit at 12% for major osteoporotic fracture, below the treatment line. The other, with a parent who broke a hip and a prior wrist fracture of their own, might clear 21%, crossing it.
If you’ve had a DXA scan recently, check whether the report already lists a femoral neck BMD value and, ideally, a FRAX score. Many radiology reports include one automatically. If yours doesn’t, ask your clinician to calculate it. It takes a few minutes and can meaningfully change how your osteopenia diagnosis gets managed.
How to get your FRAX score and prepare for the conversation
Getting a FRAX score doesn’t require a specialist referral. The official calculator lives on the FRAX developer site at the University of Sheffield, and it’s free to use. Here’s how the process typically goes:
- Select your country. FRAX uses country-specific fracture and mortality data, including U.S.-calibrated models, so the same inputs can produce different percentages depending on where you select.
- Enter your basic information. Age, sex, height, and weight are required fields; the tool calculates BMI automatically.
- Answer the yes/no risk factor questions. Prior fracture, parental hip fracture, smoking, glucocorticoid use, rheumatoid arthritis, secondary osteoporosis, and alcohol intake.
- Add femoral neck BMD if you have it. This comes from a recent DXA report; leave it blank if you haven’t had a scan, and the tool will still generate a result.
- Review both output percentages. You’ll get separate numbers for hip fracture and major osteoporotic fracture risk over the next 10 years.
Before an appointment where you plan to discuss the result, bring a few specific things: your most recent DXA report if you have one, a current medication list (particularly anything involving steroids), a written fracture history including approximate dates and how each break happened, and notes on parental hip fracture history if known.
Once you’re in front of a clinician, a short list of questions makes the conversation far more productive: What does my specific percentage mean for me? Am I above or below the treatment threshold, and by how much? Does anything in my history, like multiple fractures or long-term medication use, suggest my real risk runs higher than the number shown? What reduction in fracture risk could I realistically expect from treatment versus lifestyle changes alone?
Using FRAX as a starting point, not a verdict
A FRAX percentage is a conversation starter, not a prescription. The number tells your clinician where you sit relative to a guideline threshold; it doesn’t decide, on its own, what happens next. That decision folds in your full medical history, your DXA results, your personal risk tolerance, and often a discussion of non-drug strategies that support bone health alongside or instead of medication, at least in earlier-stage cases.
Weight-bearing exercise, resistance training, and balance work all have a supporting evidence base for maintaining bone density and reducing fall risk, which matters given that falls themselves aren’t part of the FRAX calculation. Dietary strategies around calcium, protein, and vitamin D intake come up frequently in these discussions too, and are worth reviewing in more detail if you’re building out a full plan around your nutrition targets for bone density.
Where these adjunct strategies fit depends heavily on where your FRAX number lands relative to guideline thresholds and what your clinician recommends based on your full picture. For patients below treatment thresholds who want to be proactive, or for those already on medication who want to support their bone health alongside it, mechanical loading approaches have drawn growing interest as a complementary strategy, something covered in more depth in a broader look at osteogenic loading evidence. None of this replaces a clinician’s read on your specific numbers. It’s context for the conversation you have with them.
Practical advice for interpreting your own results
A FRAX score is useful precisely because it’s narrow. It doesn’t try to capture everything about your bone health, and that restraint is what makes it reliable for the specific question it answers. The mistake I see people make most often is treating the percentage as a final answer rather than a data point to bring into a real conversation with a clinician who knows their full history.
If your number lands close to a threshold, don’t just accept it at face value in either direction. Ask specifically whether your history includes anything the calculator can’t weigh properly, multiple fractures, high-dose medication, a fall history, because those are exactly the situations where the real risk runs higher than the printed percentage.
Treatment decisions work best as a combination, not a binary choice between medication and nothing. Exercise, nutrition, and fall-prevention strategies belong in the conversation whether or not you cross a treatment threshold. Bring both your FRAX result and your DXA report to every relevant appointment. Together they tell a clinician far more than either one does alone.
— Aaron
An adjunct approach worth discussing with your clinician
If your FRAX result puts you in that in-between zone, osteopenia with some elevated risk factors but not yet at a treatment threshold, osteogenic loading is worth raising as a complementary strategy alongside whatever your clinician recommends. An approach centers on brief, weekly sessions of high-intensity mechanical loading designed to stimulate the bone-remodeling response, an approach adults managing osteopenia or osteoporosis often explore alongside medical care rather than in place of it.

A first visit typically starts with a conversation about your bone health history and current DXA or FRAX results, followed by a baseline assessment on the equipment so you understand your own starting point. Sessions run roughly ten minutes once a week, a different time commitment than a gym membership or a home exercise program, and one reason people managing bone density concerns have added it to their routine alongside vibration therapy, red light therapy, and other recovery-focused services available at some centers. If you want to see what the research actually says about how this fits into a broader bone-health plan, the osteogenic loading evidence page breaks it down in plain terms. From there, scheduling a visit is the next step if you want to see how it fits into your own plan.
This article is general information, not a substitute for advice from a qualified doctor. Consult a qualified healthcare professional about your own circumstances before acting on anything here.
Sources
- An overview of the use of the fracture risk assessment tool (FRAX) in osteoporosis
- Welcome to FRAX ®